Master the Market
Technical analysis made simple. Explore our library of high-probability chart patterns and learn how to trade them like a pro.
bullish
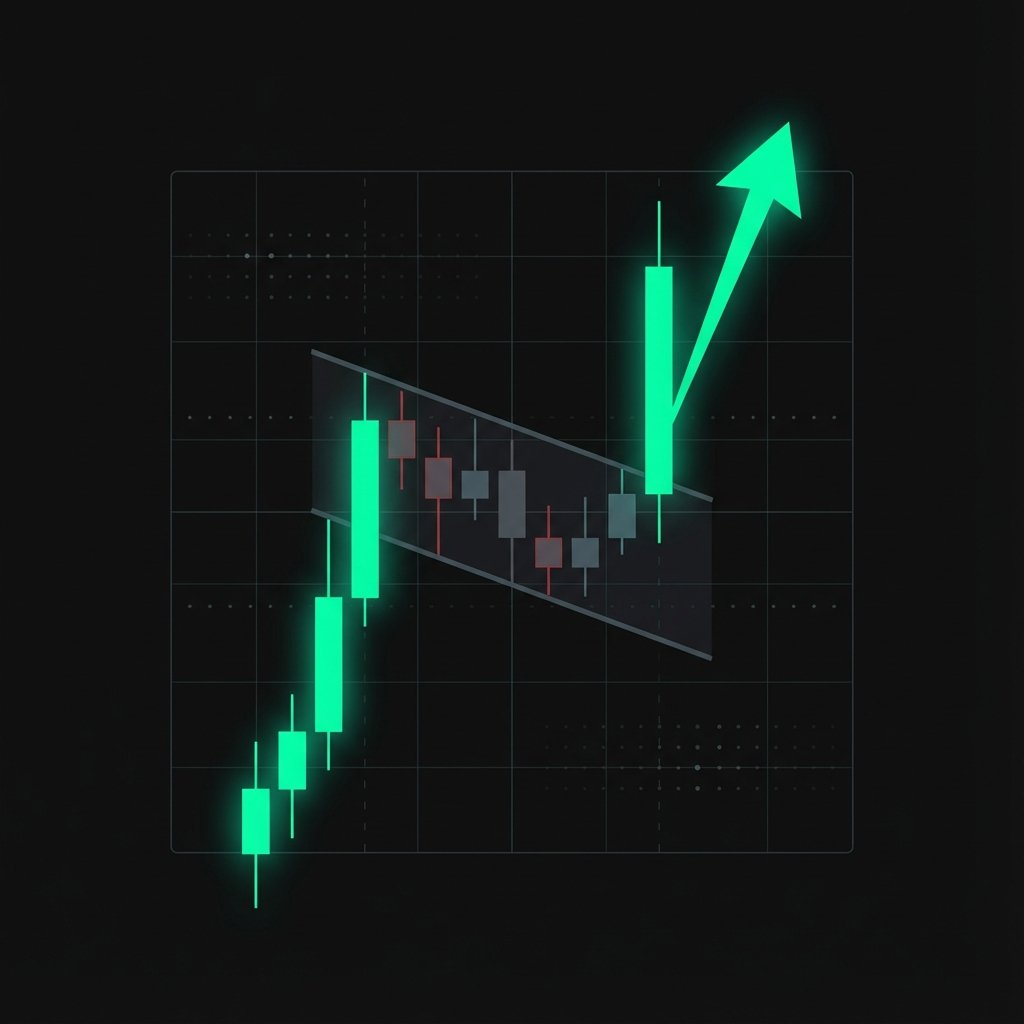
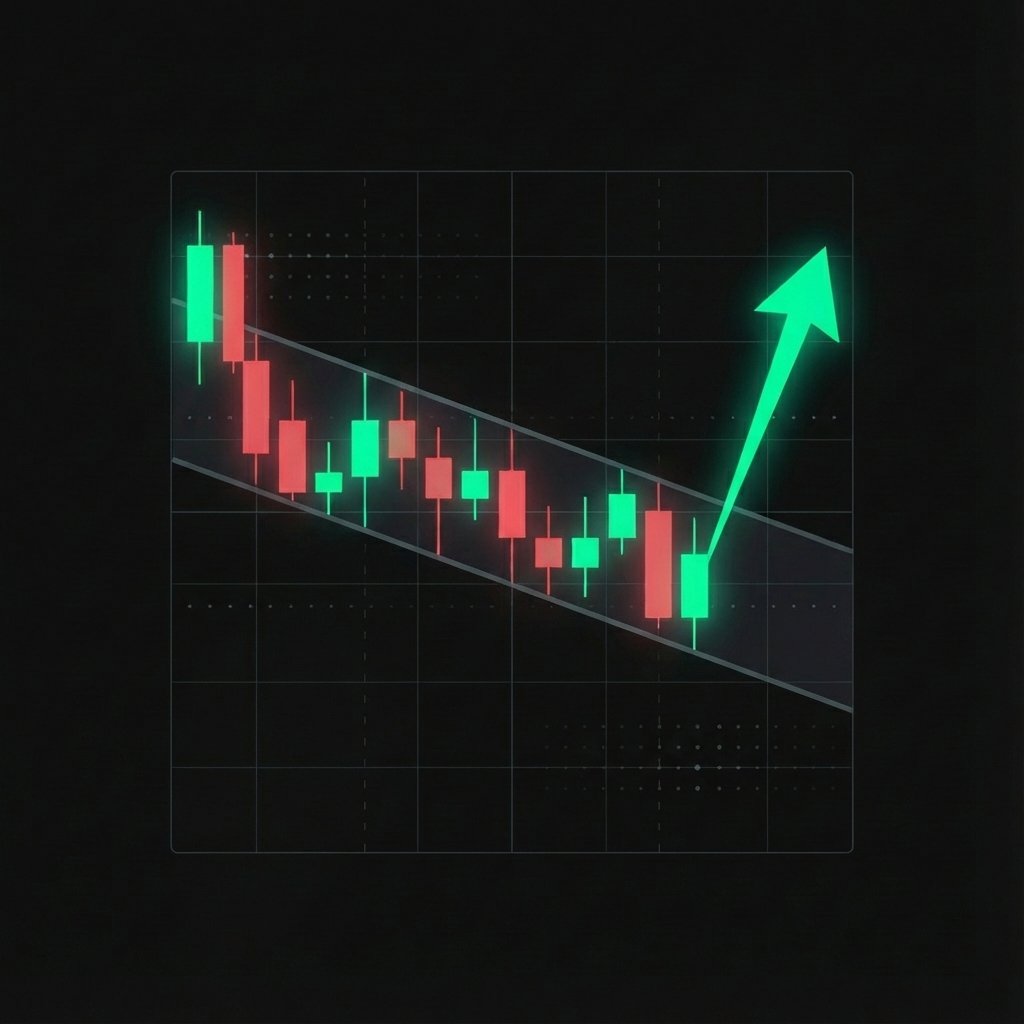
Bullish Flag
A bullish flag is a continuation pattern that occurs after a sharp price increase (the pole). It consists of a short period of consolidation within a parallel, downward-sloping channel (the flag).
Start Learning
bearish
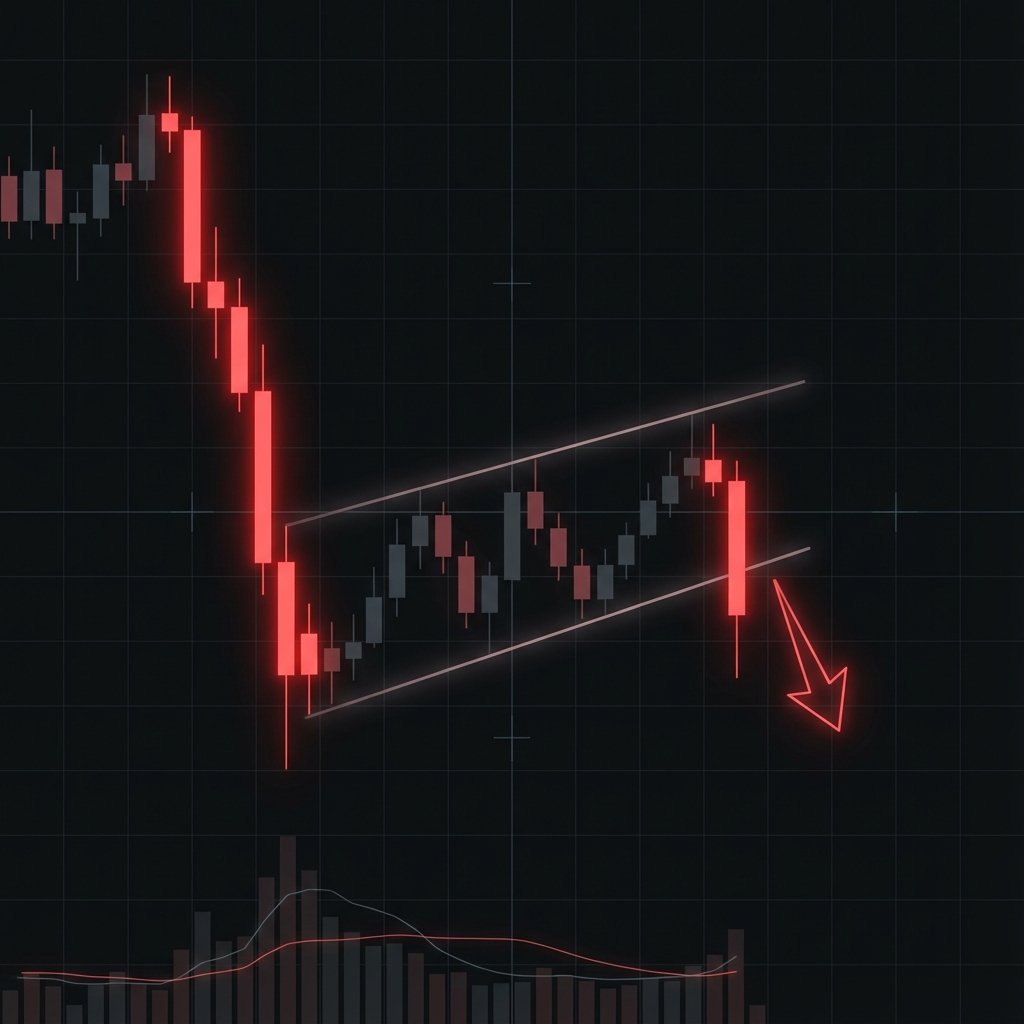
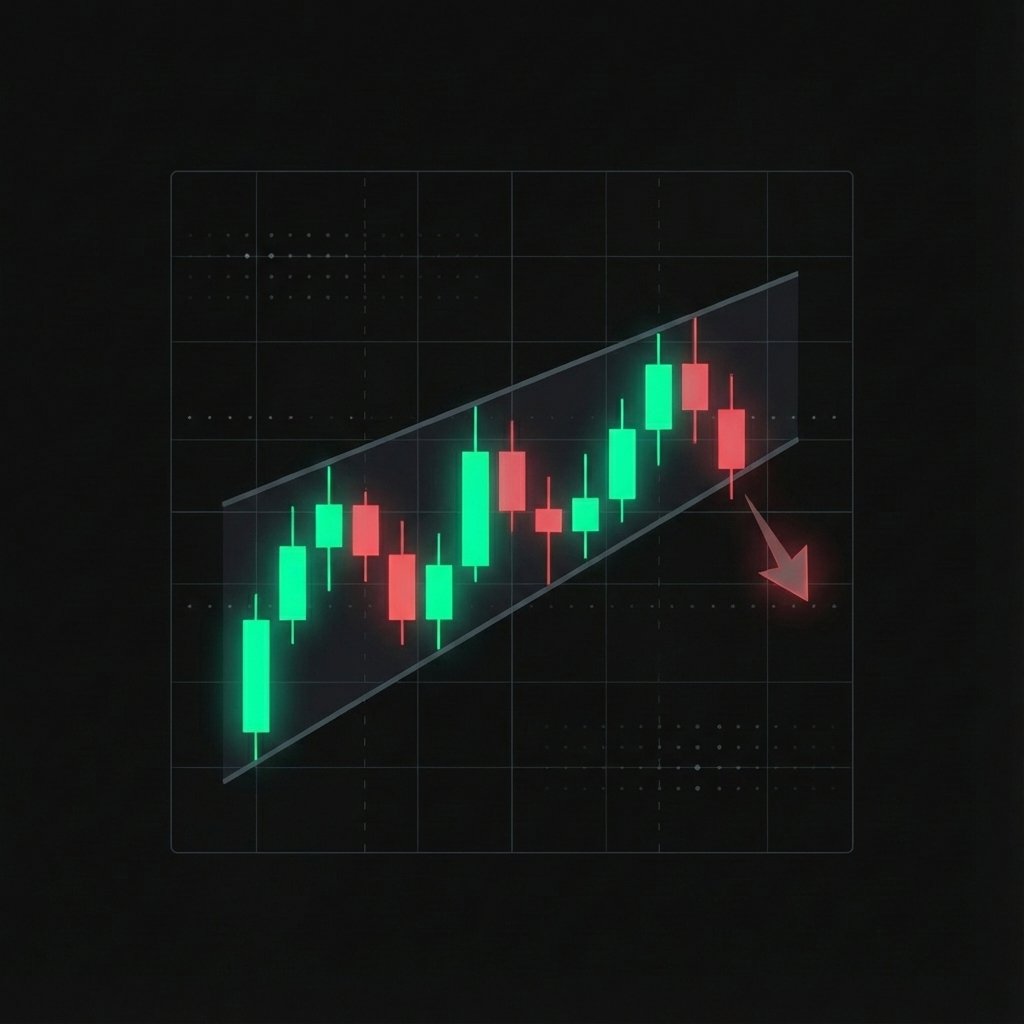
Bearish Flag
A bearish flag is a continuation pattern that appears after a sharp price decline. It features a brief upward-sloping consolidation channel before the downtrend resumes.
Start Learning
bullish
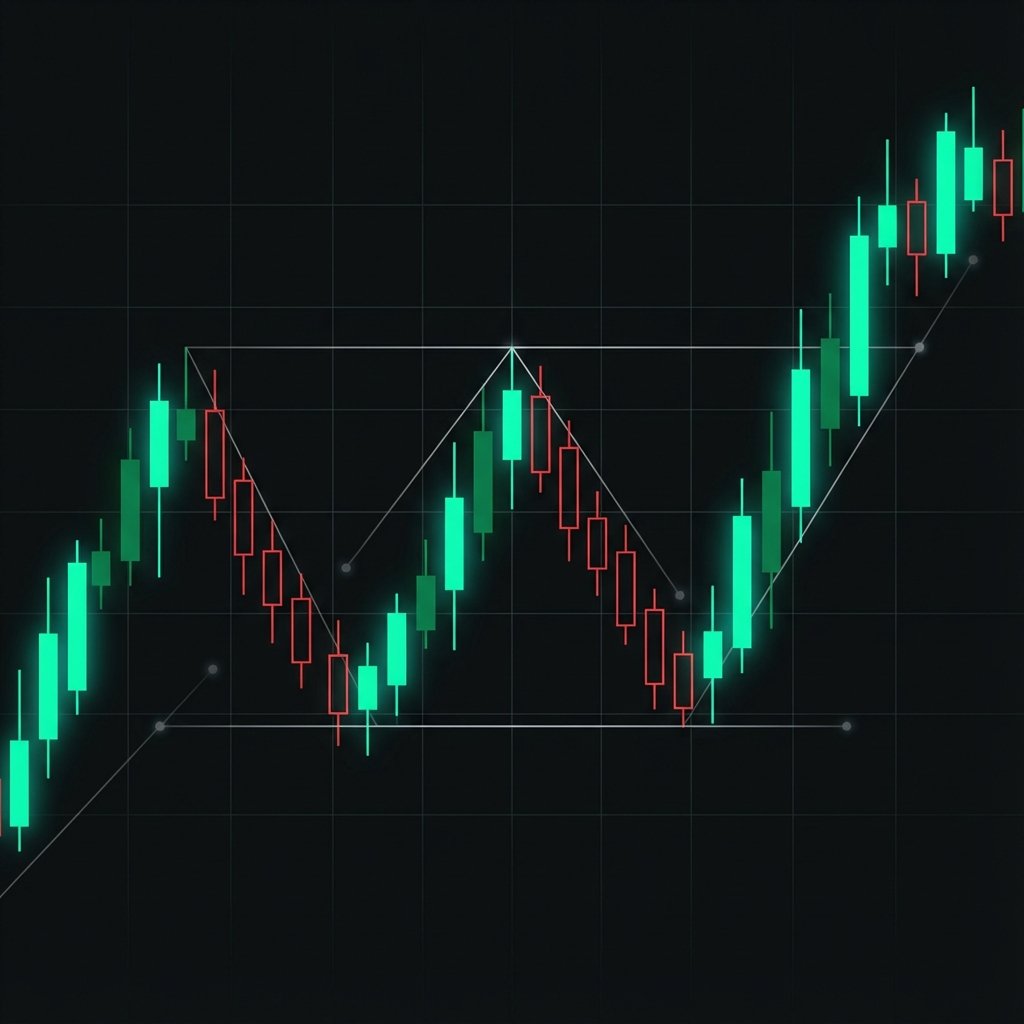
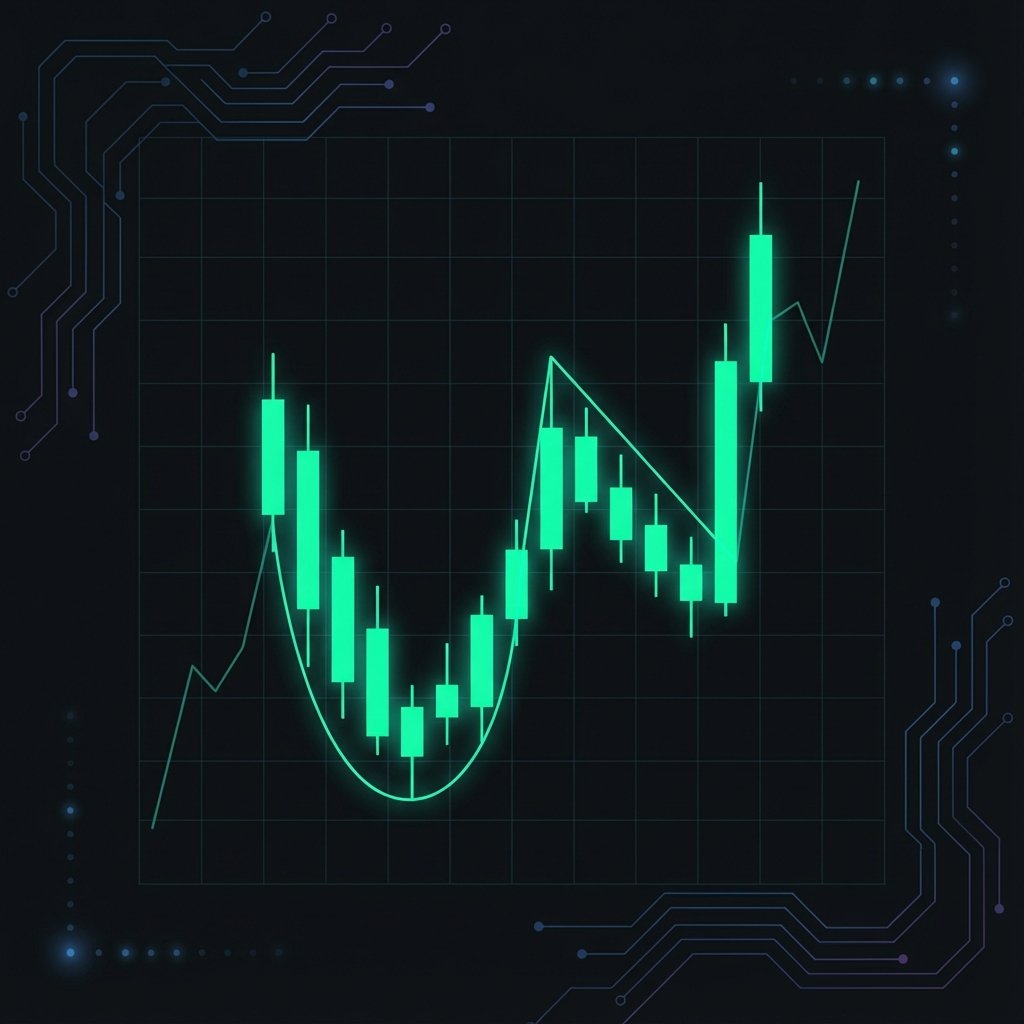
Double Bottom
A double bottom is a major reversal pattern that occurs after an extended downtrend. It resembles the letter "W" and shows two distinct lows reaching a similar level.
Start Learning
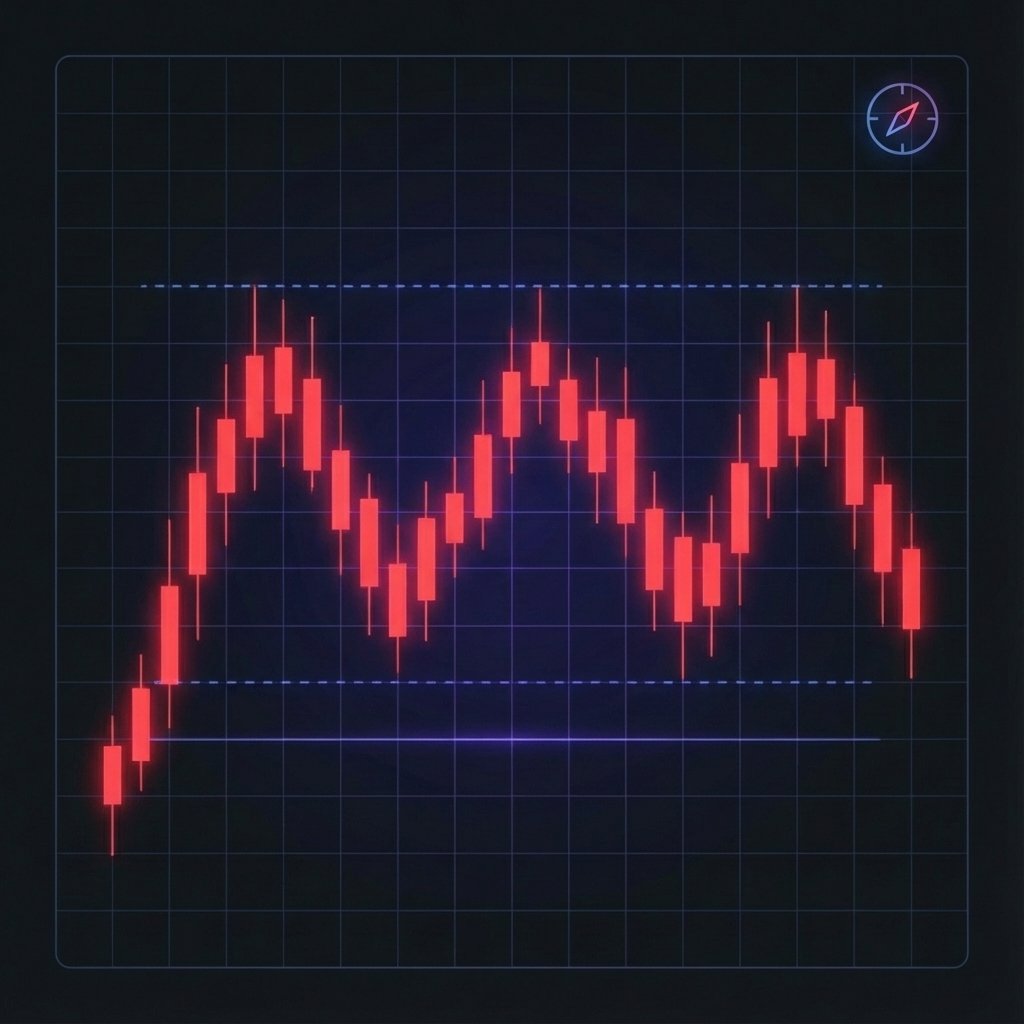
bearish
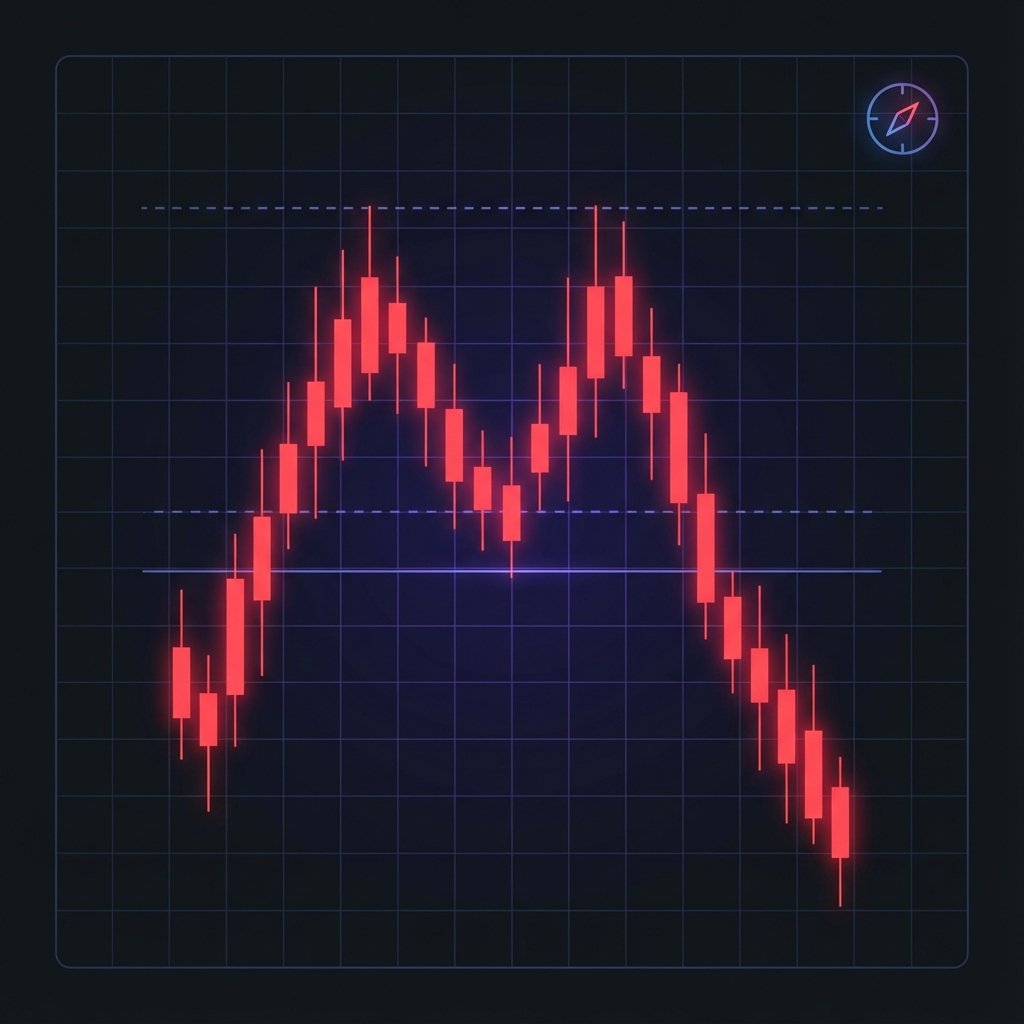
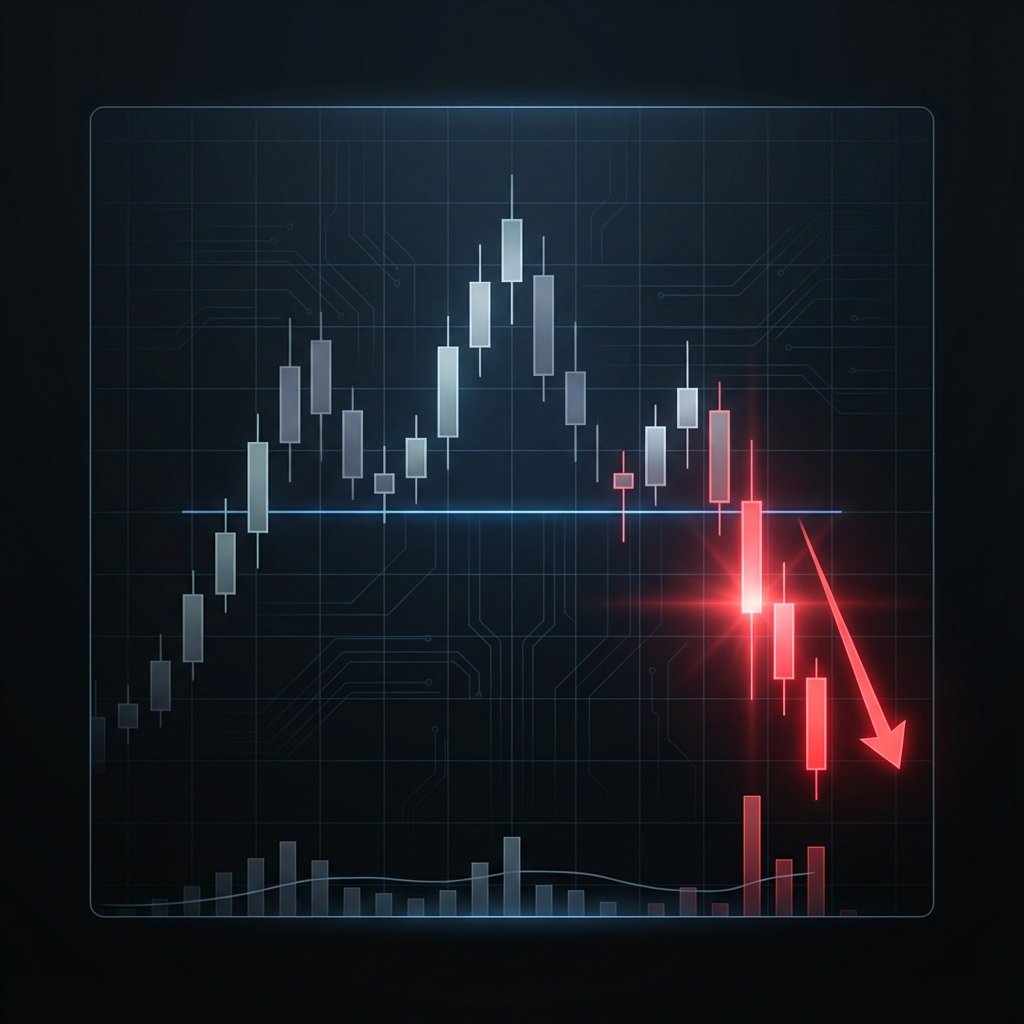
Double Top
A double top is a reversal pattern appearing at the peak of an uptrend. It looks like the letter "M" and signifies that the price has failed to break a specific resistance level twice.
Start Learning
bullish
Cup and Handle
The cup and handle is a bullish continuation pattern. The "cup" is a rounded bottom (U-shape), and the "handle" is a slight downward drift at the end of the cup.
Start Learning
bearish
Head and Shoulders
One of the most reliable reversal patterns, consisting of three peaks: a higher middle peak (head) and two lower peaks on either side (shoulders).
Start Learning
bullish
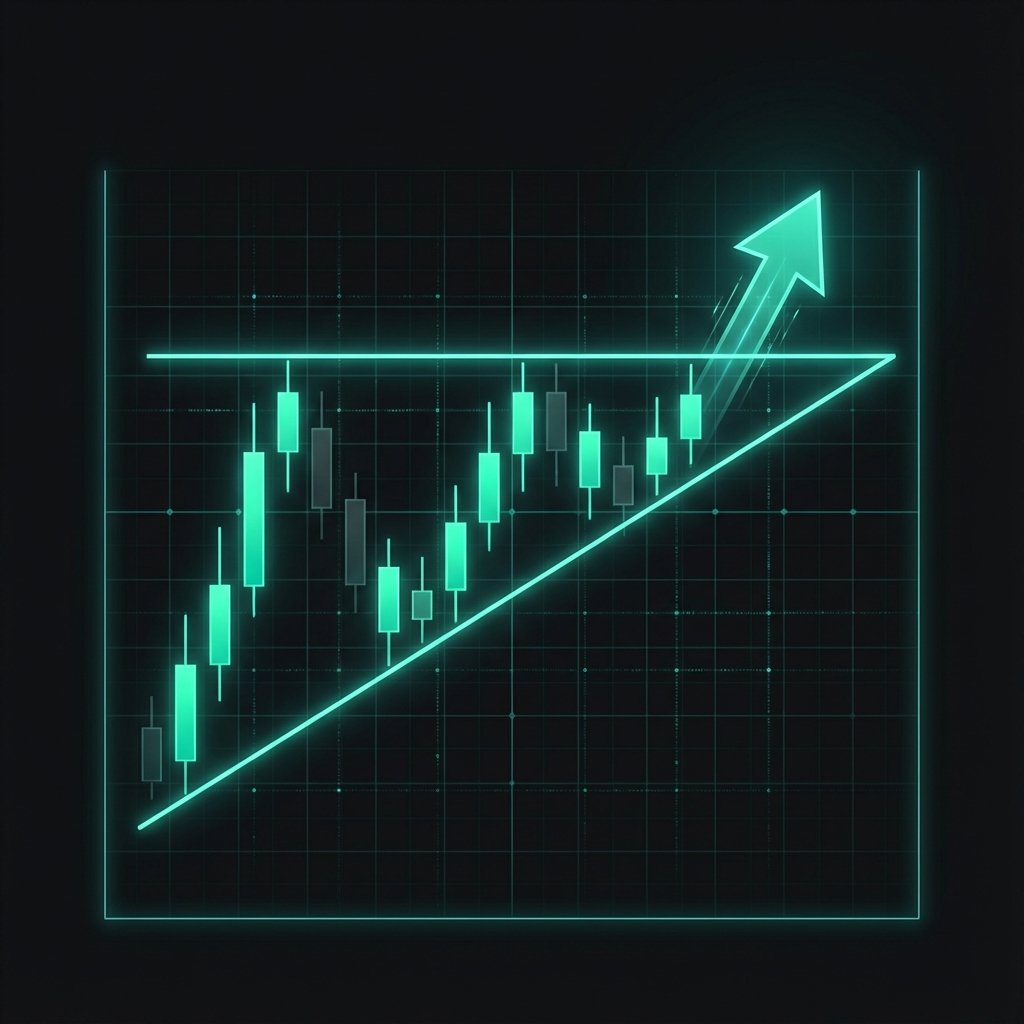
Ascending Triangle
A bullish continuation pattern characterized by a flat resistance line and an ascending support line. Price gets squeezed into the apex before breaking out.
Start Learning
bearish
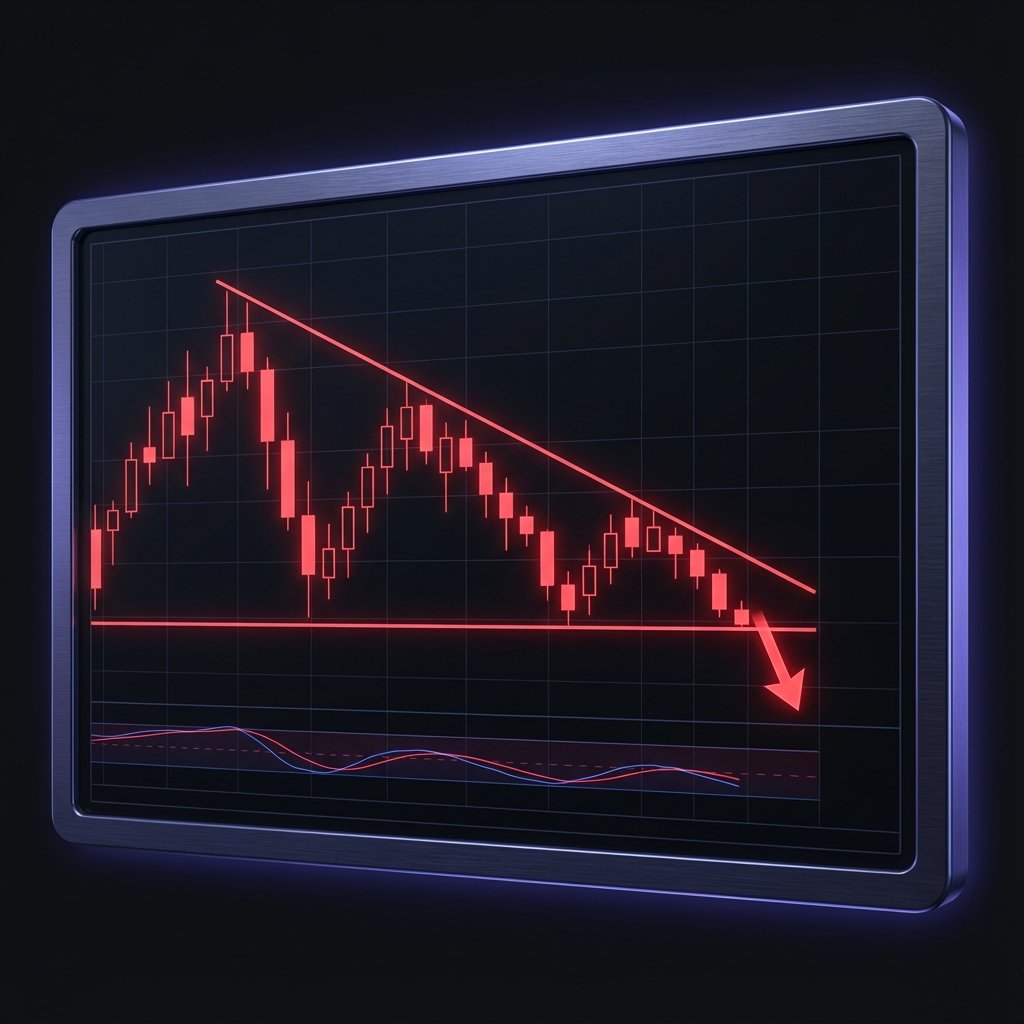
Descending Triangle
A bearish continuation pattern with a flat support line and a descending resistance line. It signals that sellers are in control.
Start Learning
bearish
Rising Wedge
A rising wedge is a bearish reversal pattern that forms when price makes higher highs and higher lows, but the range narrows over time. It typically appears at the end of an uptrend.
Start Learning
bullish
Falling Wedge
A falling wedge is a bullish reversal pattern that forms when price makes lower lows and lower highs within a narrowing range. It signals that selling pressure is decreasing.
Start Learning
bullish
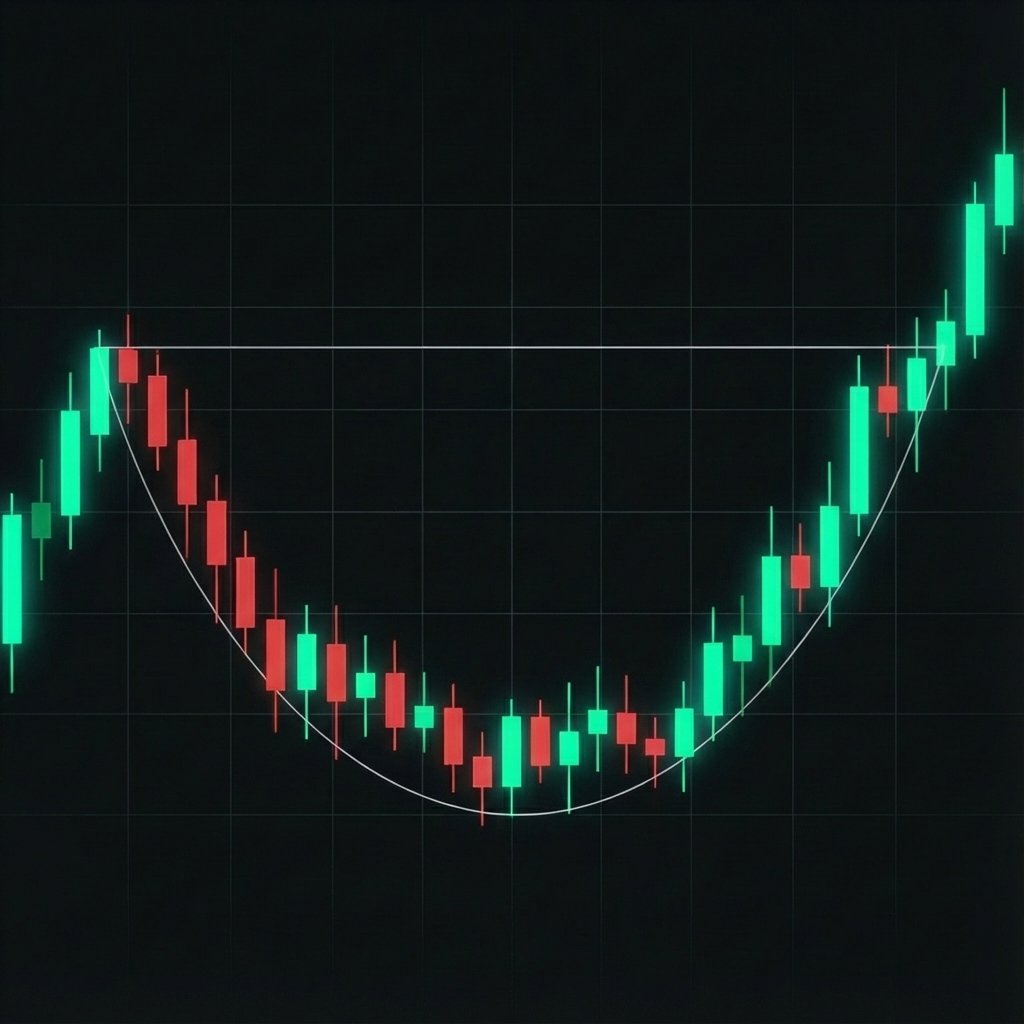
Rounding Bottom
Also known as a "saucer bottom," this is a long-term reversal pattern that shows a gradual shift from a downtrend to an uptrend. The price forms a U-shaped curve over an extended period.
Start Learning
neutral
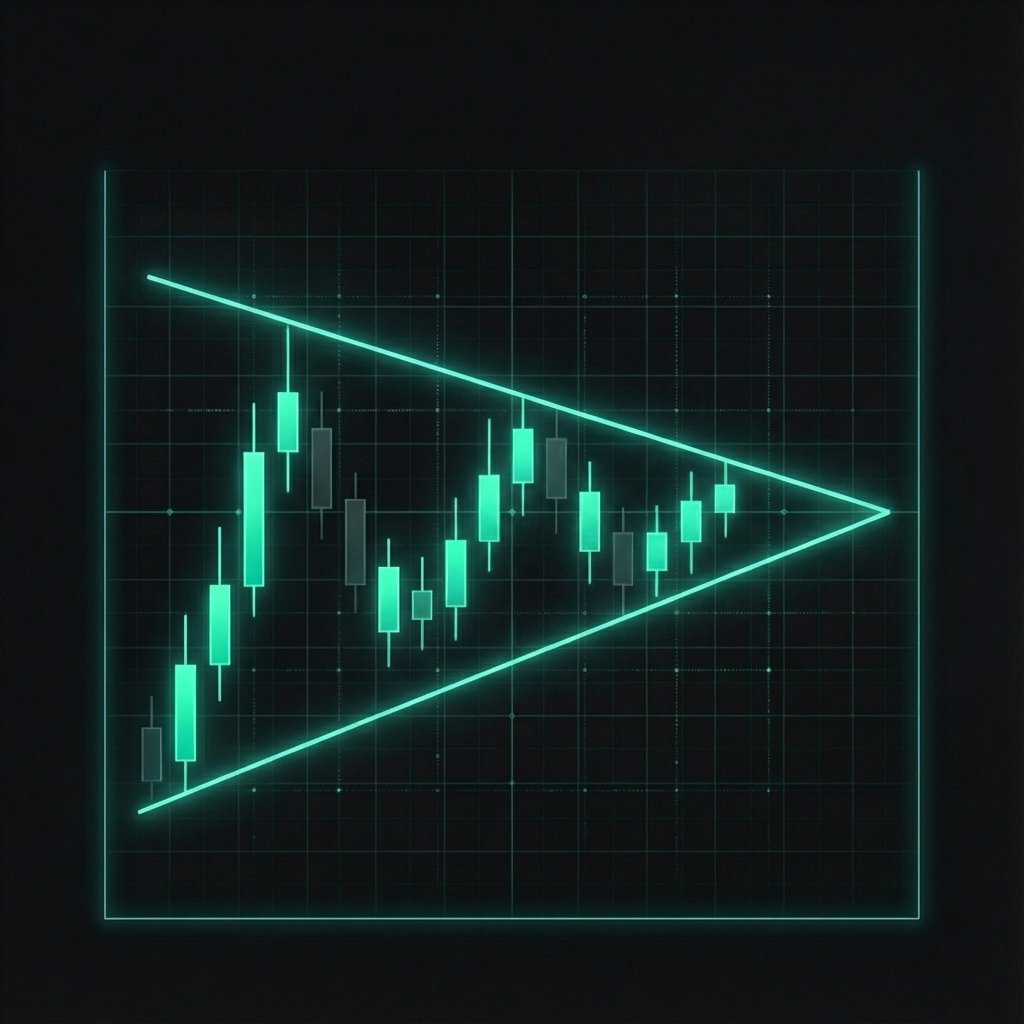
Symmetrical Triangle
A symmetrical triangle is a consolidation pattern where price makes both lower highs and higher lows, converging toward an apex. It can break in either direction.
Start Learning
neutral
Rectangle
A rectangle pattern forms when price bounces between a horizontal support and resistance level, creating a range-bound trading zone. It can break in either direction.
Start Learning

neutral
Broadening Formation
Also called a "megaphone" pattern, this formation is characterized by higher highs and lower lows, creating an expanding range. It signals increasing volatility and market uncertainty.
Start Learning

neutral
Diamond
A diamond pattern combines a broadening formation followed by a symmetrical triangle. Price expands then contracts, forming a diamond shape. It is typically a reversal pattern.
Start Learning