Back to Patterns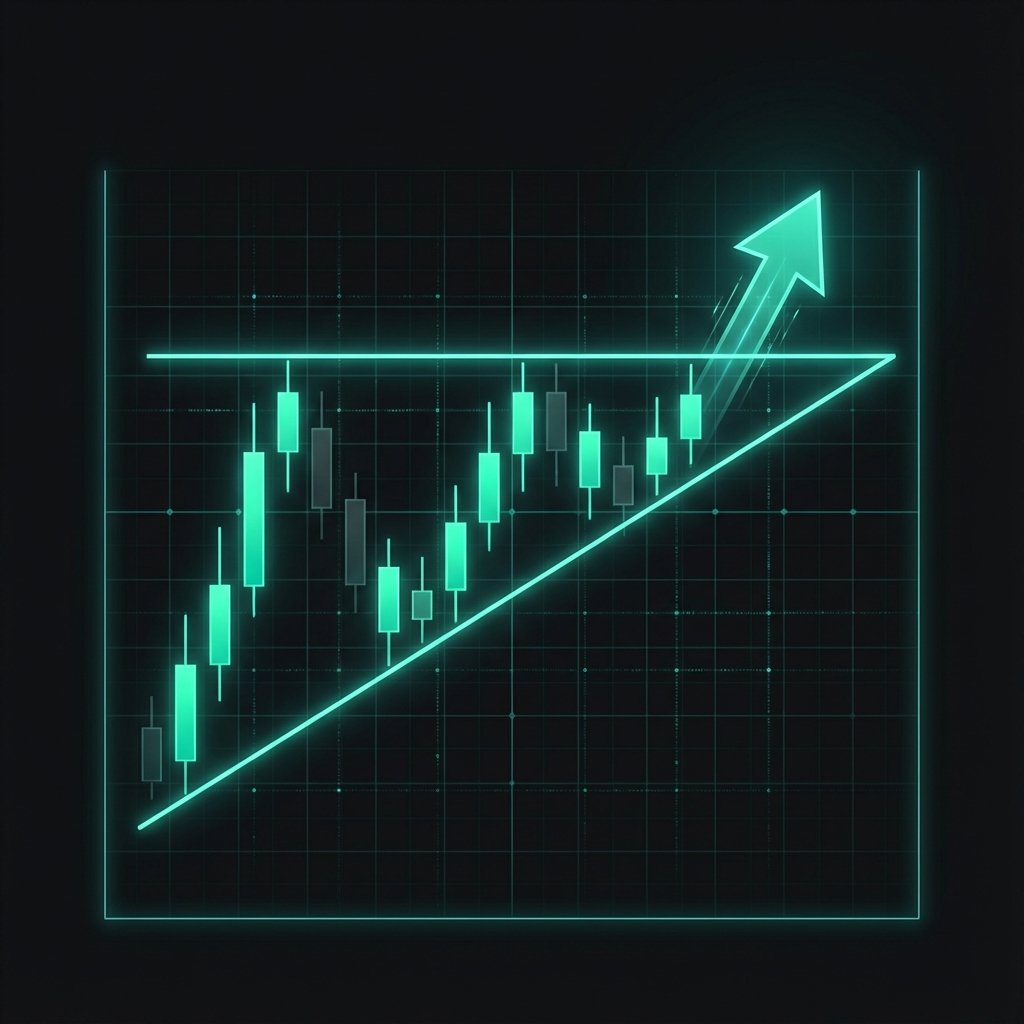
bullish Signal
Ascending Triangle
An ascending triangle is a bullish continuation pattern defined by a flat horizontal resistance line at the top and a rising support line connecting progressively higher lows. The price is coiling into the apex, building energy for a breakout above the resistance line.
How to Trade
Enter long when price closes above the horizontal resistance line with a notable volume increase. The profit target is the height of the triangle (the widest point at the left) projected upward from the breakout point.
Market Psychology
Buyers are becoming increasingly aggressive with each pullback — they are willing to buy at higher and higher prices, evidenced by the rising lows. Sellers are defending the same resistance level but with decreasing success. Each test of resistance exhausts more selling supply until buyers finally overwhelm it.
Technical Diagram
This visual represents the ideal candle formation and breakout points for the Ascending Triangle pattern.
Key Characteristics
A flat, horizontal resistance line created by at least two price peaks at approximately the same level
A rising support line connecting at least two higher lows
The pattern should have at least 4 contact points (2 on resistance, 2 on support) to be valid
Price typically breaks out in the upper two-thirds of the triangle before reaching the apex
Volume generally contracts during pattern formation and expands sharply on the breakout
Trading the Ascending Triangle
Entry Signals
Enter long on a confirmed candle close above the horizontal resistance line, ideally accompanied by a volume surge. Avoid entering too close to the apex — price that reaches within 20% of the apex without breaking out often results in a failed or indecisive pattern. Some traders also enter on pullbacks to the resistance line after a confirmed breakout.
Risk Management
Place the stop loss below the most recent higher low within the triangle or just below the midpoint of the triangle. The pattern is considered failed if price breaks below the rising support line before breaking above resistance.
Profit Targets
Measure the maximum height of the triangle at its widest point (the left side, from resistance down to the first support point). Project that distance upward from the breakout point. This is the minimum measured move. Strong uptrending markets often see the move exceed this target.
Timeframes
Valid across all timeframes, but most powerful on daily and weekly charts. The pattern is particularly effective in trending markets where the ascending triangle acts as a consolidation before the next leg up. Intraday ascending triangles offer quick-resolution trades but require tighter risk management.
Volume Context
Volume should decline throughout the triangle formation as the price range contracts — fewer participants are needed to maintain the pattern. On the breakout above resistance, volume should surge meaningfully. A flat or declining volume breakout has a notably higher probability of reversal back into the triangle.
Historical Success Rate
Ascending triangles are among the most reliable continuation patterns. Thomas Bulkowski found ascending triangles have an upward breakout rate of approximately 77% and an average price increase of 38% after confirmation. The pattern becomes more reliable the longer it takes to form and the more touch points it has on both trendlines.
Common Mistakes to Avoid
Entering too late — chasing the breakout well above resistance dramatically worsens the risk-reward profile
Not requiring at least 4 trendline contact points — patterns with only 2 contact points are too ambiguous
Waiting too long and letting price reach the apex — breakouts from near the apex are less reliable
Ignoring the broader trend context — ascending triangles in an overall uptrend perform significantly better than those in downtrending markets
Trading a symmetrical triangle as if it were an ascending triangle — these are different patterns with different directional biases
Ascending Triangle — Frequently Asked Questions
What is an ascending triangle?
An ascending triangle is a bullish continuation pattern with a flat horizontal resistance line and a rising support line. The progressively higher lows show buyers are gaining control, and a breakout above the flat resistance confirms the continuation of the uptrend.
How do I trade an ascending triangle?
The standard approach is to enter long on a confirmed candle close above the flat resistance line, ideally with a volume surge. Place your stop below the most recent higher low in the triangle. The profit target is the triangle's maximum height projected upward from the breakout.
Can an ascending triangle break to the downside?
Yes. While ascending triangles have an upward breakout bias (~77% of the time), approximately 23% do break to the downside. This can happen during weak market conditions or after a very prolonged consolidation. Volume confirmation on the breakout direction is essential.
How is an ascending triangle different from a symmetrical triangle?
In an ascending triangle, the top resistance is flat while the bottom support rises — giving it a bullish bias. In a symmetrical triangle, both trendlines converge (one descending, one ascending), making it a neutral pattern that can break in either direction.