Back to Patterns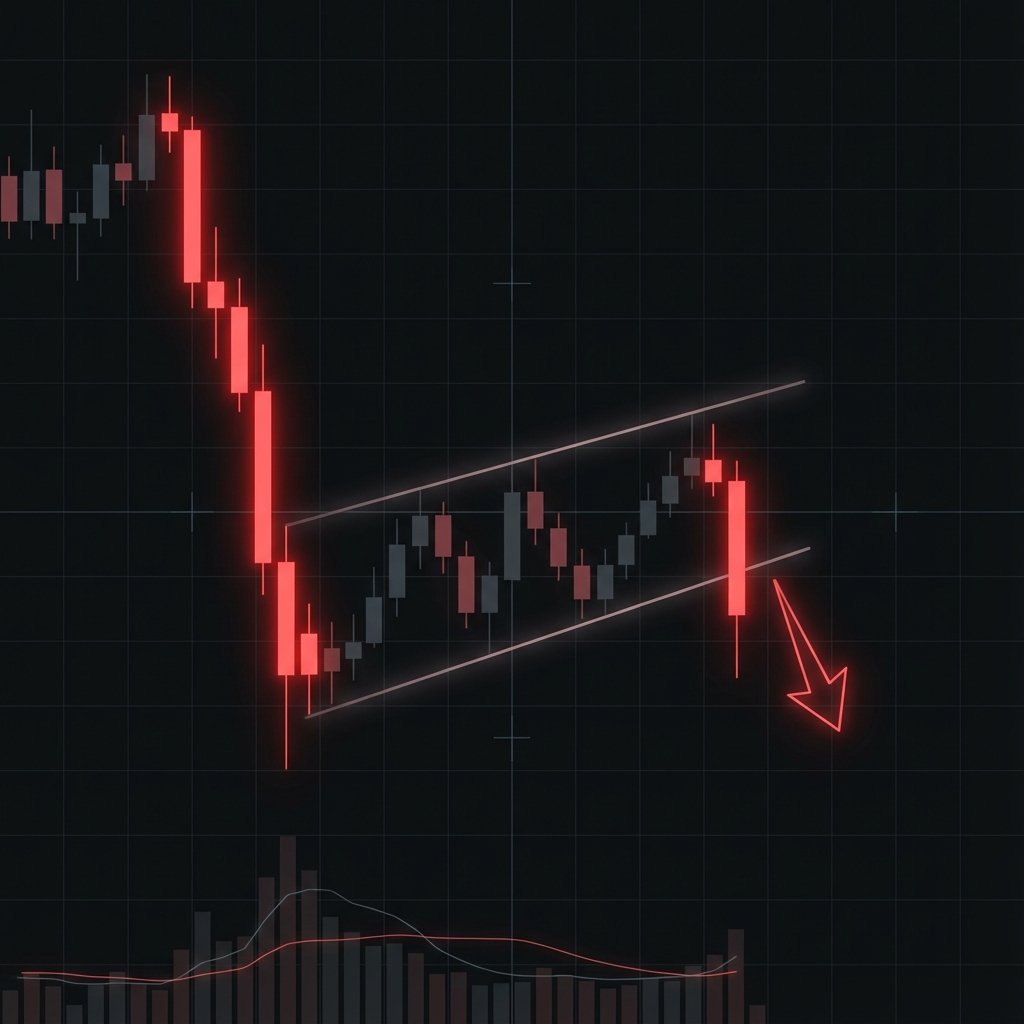
bearish Signal
Bearish Flag
A bearish flag is a continuation pattern that appears after a sharp price decline (the pole). It features a brief upward-sloping consolidation channel (the flag) before the downtrend resumes with full force.
How to Trade
Enter a short position upon a confirmed candle close below the lower support line of the flag. Place a stop loss above the highest point of the flag. The profit target is the height of the pole projected downward from the breakout point.
Market Psychology
Following a sharp drop, a temporary "dead cat bounce" occurs as short-sellers take profits and bargain hunters step in. However, the upward drift is on weak volume, revealing a lack of genuine buying conviction. New selling pressure eventually overwhelms the flag, leading to a continuation of the decline.
Technical Diagram
This visual represents the ideal candle formation and breakout points for the Bearish Flag pattern.
Key Characteristics
Sharp, near-vertical price decline forming the pole — typically a 15–40% drop in a short period
Brief consolidation in a parallel, upward-sloping channel (the flag) on declining volume
Flag typically retraces 30–50% of the pole; deeper retracements weaken the bearish case
Breakdown below the lower flag support line on above-average volume confirms the pattern
The flag formation usually completes in 5–20 sessions on daily charts
Trading the Bearish Flag
Entry Signals
Enter short on a confirmed candle close below the lower support line of the flag. Look for volume to expand on the breakdown candle relative to the subdued volume during the flag consolidation. This volume confirmation is critical — a low-volume breakdown has a much higher failure rate.
Risk Management
Place your stop loss just above the highest wick within the flag consolidation. Risk no more than 1–2% of capital per trade. If price reverses back into the flag and closes above the midpoint of the pole, treat the pattern as failed and cover the position.
Profit Targets
Measure the height of the pole (top of the pole to the bottom). Project that distance downward from the breakdown point. Consider covering 50% of the position at the midpoint of the target, then trailing a stop on the remainder to capture extended downside moves.
Timeframes
Valid on all timeframes from intraday (15-minute, 1-hour) through daily and weekly charts. Higher-timeframe bearish flags on daily and weekly charts tend to produce larger, more sustained moves. Intraday flags offer quicker resolution but require tighter risk management.
Volume Context
During the flag (the upward consolidation), volume should dry up noticeably — ideally 30–50% below the recent average. This low-volume bounce is the hallmark of a bearish flag. When price breaks below the flag support, volume should surge, confirming genuine selling pressure and a high-probability continuation of the downtrend.
Historical Success Rate
Bearish flag patterns have a historically reported success rate of approximately 67% when the breakdown is confirmed by elevated volume. In strong downtrending markets or during periods of broad market weakness, this success rate can increase. The pattern is most reliable when the initial pole drop was accompanied by high volume.
Common Mistakes to Avoid
Entering short before the breakdown candle closes — early entries are stopped out frequently as flags often extend
Ignoring volume on the breakdown — low-volume breakdowns below the flag fail at a much higher rate
Trading flags with shallow poles (less than 15%) — strong initial selling pressure is required for a valid setup
Placing stops too tight inside the flag — normal consolidation volatility will trigger premature exits
Holding through major support levels — bearish flags near key horizontal support can fail sharply on reversals
Bearish Flag — Frequently Asked Questions
What is a bearish flag pattern?
A bearish flag is a continuation pattern consisting of a sharp downward move (the pole) followed by a brief upward consolidation in a parallel channel (the flag). A breakdown below the flag signals that the prior downtrend is resuming.
How do I identify a bearish flag?
Look for a sharp, steep price drop followed by a consolidation that drifts slightly higher in a parallel channel. Volume should decline during the flag and expand on the breakdown. The flag should not retrace more than 50% of the pole for the pattern to remain valid.
What is the profit target for a bearish flag?
The standard target is the pole height projected downward from the breakout point. Measure from the top of the pole to the bottom (the flag starting point), then subtract that distance from the flag breakdown level.
How is a bearish flag different from a bear pennant?
Both patterns form after a sharp decline, but in a bearish flag the consolidation occurs within parallel trendlines (a rectangle), while a bear pennant uses converging trendlines (a small symmetrical triangle). Both have similar trading rules — enter on the breakdown, target the pole height.