Back to Patterns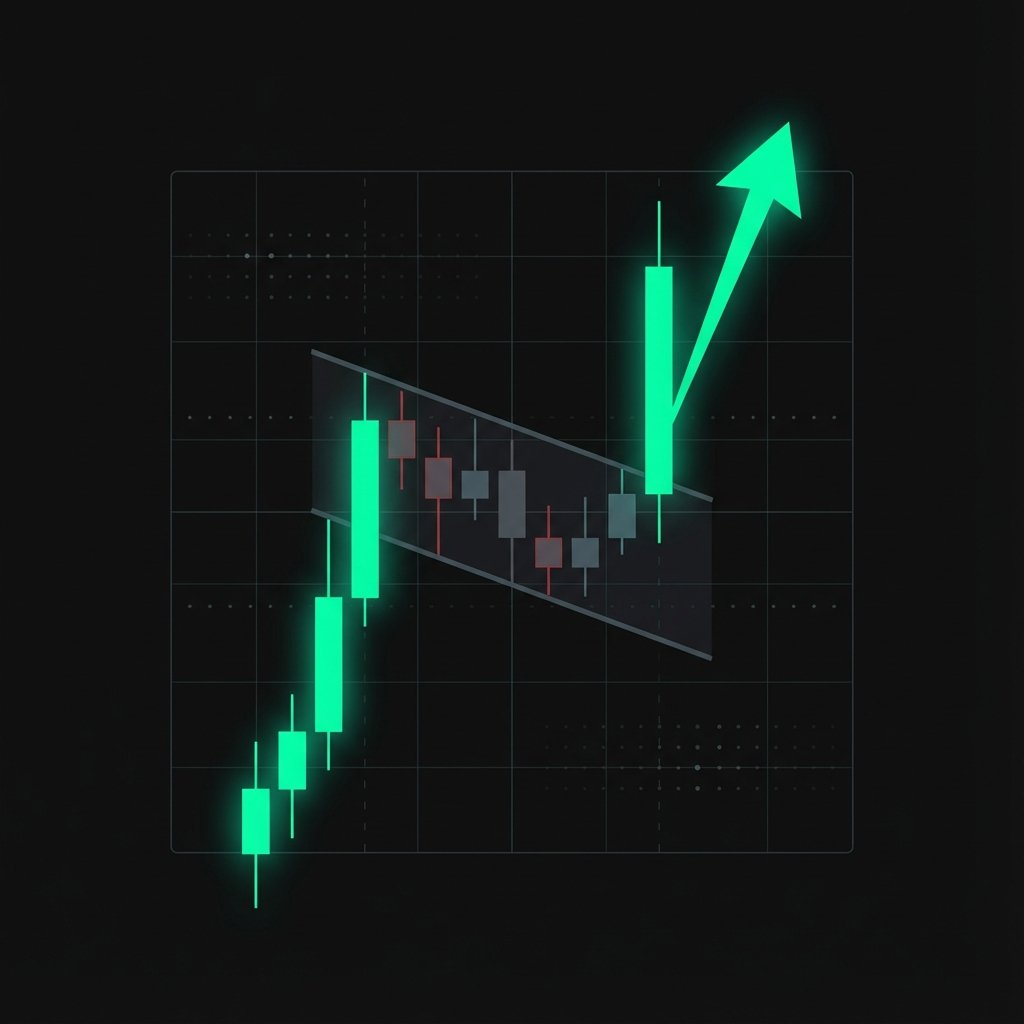
bullish Signal
Bullish Flag
A bullish flag is a continuation pattern that occurs after a sharp price increase (the pole). It consists of a short period of consolidation within a parallel, downward-sloping channel (the flag), before the prior uptrend resumes.
How to Trade
Enter a long position when the price breaks above the upper resistance line of the flag on a confirmed candle close. Set a stop loss below the lowest point of the flag. Your profit target is the height of the pole projected upward from the breakout point.
Market Psychology
After a strong rally, some traders take profits, leading to a minor consolidation. However, the underlying demand remains strong. The declining volume during the flag shows sellers are losing conviction, and the breakout signals that the bulls have fully regained control.
Technical Diagram
This visual represents the ideal candle formation and breakout points for the Bullish Flag pattern.
Key Characteristics
Strong, near-vertical price surge forming the pole — typically a 15–40% advance in a short period
Brief consolidation in a parallel, downward-sloping channel (the flag) with declining volume
Flag typically retraces 30–50% of the pole; retracements deeper than 50% weaken the setup
Breakout above the upper flag trendline on above-average volume confirms the pattern
The entire flag formation usually completes in 5–20 trading sessions on daily charts
Trading the Bullish Flag
Entry Signals
Enter long on a confirmed candle close above the upper resistance line of the flag. Look for volume to surge at least 1.5x above average on the breakout candle. Aggressive traders may enter intrabar as the price breaks out; conservative traders wait for the candle to close above resistance before committing.
Risk Management
Place your stop loss just below the lowest wick of the flag consolidation. Risk no more than 1–2% of your total trading capital per trade. If the flag retraces more than 50% of the pole height, the setup is considered invalidated and the position should be exited.
Profit Targets
Measure the full height of the pole from its base to its peak. Project that same distance upward from the exact breakout point. Consider taking partial profits (50%) at the midpoint of the projected target, then trailing your stop on the remainder to capture extended moves.
Timeframes
Effective across all timeframes. Day traders favour 5-minute to 1-hour charts; swing traders use 4-hour to daily charts. Patterns on longer timeframes carry more statistical weight and tend to produce larger moves. Avoid trading flags on tick charts where volume data is less reliable.
Volume Context
Volume is the single most important confirming factor for this pattern. Volume should contract noticeably during the flag — ideally falling 30–50% below its recent average — signalling a lack of selling conviction. On the breakout candle, volume should surge strongly above average. A breakout on low or average volume has a significantly higher failure rate.
Historical Success Rate
Bullish flag patterns have a historically reported success rate of approximately 67% on daily charts when the breakout is confirmed by above-average volume. In strong bull market conditions, this success rate can climb to 80% or higher. Flags that form on high relative volume poles — where the initial surge was accompanied by exceptional buying volume — tend to outperform.
Common Mistakes to Avoid
Entering before the breakout candle closes — the flag can continue consolidating, stopping you out prematurely
Ignoring volume on the breakout — a low-volume breakout fails far more often than one backed by strong buying
Trading flags where the pole is too shallow (less than 15%) — a valid bull flag requires a powerful initial surge
Setting a stop loss that is too tight within the flag — normal flag volatility will trigger it before the actual move
Chasing the trade well above the breakout point — entering late reduces your reward-to-risk ratio significantly
Bullish Flag — Frequently Asked Questions
What is a bullish flag pattern?
A bullish flag is a short-term continuation pattern consisting of a sharp upward move (the pole) followed by a brief consolidation in a downward-sloping parallel channel (the flag). When the price breaks out above the upper channel line, it signals that the prior uptrend is resuming.
How do I confirm a bullish flag breakout?
A valid breakout occurs when the price closes above the upper resistance line of the flag accompanied by a volume surge — typically 1.5x or more above the recent average. A strong, full-bodied bullish candle on high volume provides the highest-confidence confirmation.
What is the price target for a bull flag?
The standard price target is calculated by measuring the pole height (from the base of the initial move to the top) and projecting that distance upward from the breakout point. For example, if the pole was a $10 move and breakout occurs at $50, the primary target is $60.
How is a bull flag different from a pennant?
Both patterns follow a sharp pole, but the consolidation phase differs. A bull flag consolidates in a parallel channel (rectangular), while a pennant consolidates in a converging symmetrical triangle. Both are valid continuation setups, but the pennant tends to be shorter-duration and tighter.