Back to Patterns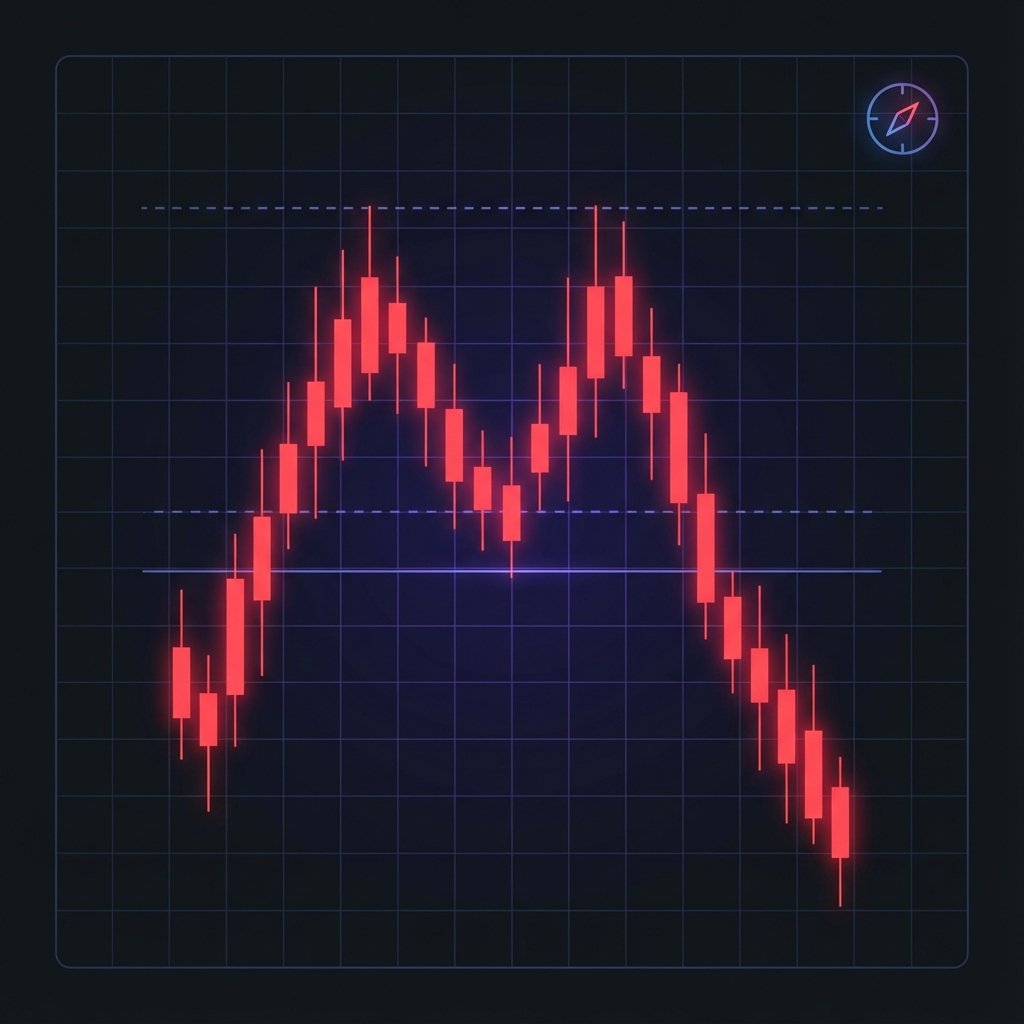
bearish Signal
Double Top
A double top is a major bearish reversal pattern that appears at the peak of an uptrend. It resembles the letter "M," showing price has failed to break a specific resistance level twice — a clear signal that buyers are losing control and a trend reversal is imminent.
How to Trade
Sell or enter a short position when the price breaks below the neckline (the trough between the two peaks) on a confirmed candle close with elevated volume. Many traders wait for a retest of the neckline from below before entering short.
Market Psychology
After a strong uptrend, price reaches a peak and then pulls back as traders take profits. The second attempt to push higher fails at the same resistance, confirming that buyers lack the conviction to push to new highs. The failed second attempt traps longs and emboldens shorts.
Technical Diagram
This visual represents the ideal candle formation and breakout points for the Double Top pattern.
Key Characteristics
Two distinct price peaks at approximately the same level, forming the letter "M"
The two peaks should be separated by a trough (the neckline), typically 10–20% below the highs
Volume is often higher on the first peak; the second peak typically forms on lighter volume — a warning sign
The second peak frequently fails to exceed the first peak in either price or volume
The troughs should ideally be at least 4–6 weeks apart on daily charts for the pattern to carry weight
Trading the Double Top
Entry Signals
The primary entry is on a confirmed candle close below the neckline on above-average volume. A more precise — and lower-risk — entry is to wait for a rally back up to the neckline after the initial breakdown, which now acts as resistance, and enter short on the rejection.
Risk Management
For neckline breakdown entries, place the stop above the second top. For neckline retest entries, a tighter stop just above the retest high suffices. The pattern is invalidated if price closes back above the second peak.
Profit Targets
Measure the height of the pattern from the peaks to the neckline. Project that distance downward from the neckline breakdown point. This gives the standard minimum target. In weak market conditions, double tops often produce moves that significantly exceed this measured target.
Timeframes
Most reliable on daily and weekly charts where the two peaks represent genuine institutional supply levels. Intraday double tops occur frequently but carry less significance and require tighter risk management due to increased noise.
Volume Context
Volume should be higher on the first peak than on the second — the volume divergence between the two peaks is one of the most reliable early warning signs. The neckline breakdown should be accompanied by a surge in volume. A breakdown on light volume has a significantly higher probability of failing.
Historical Success Rate
Thomas Bulkowski's research found double top patterns have a success rate of approximately 65–75% when the neckline break is confirmed with volume. Patterns where the second peak is clearly below the first (a lower high) have a higher success rate than patterns where both peaks reach the exact same price level.
Common Mistakes to Avoid
Entering short at the second peak before the neckline is confirmed as broken — the pattern is not valid until the neckline breaks
Treating every two-peak formation as a double top — the pattern must form after a meaningful uptrend to be a reversal signal
Ignoring volume divergence — the second peak on heavy volume is a warning the pattern may not follow through
Missing the neckline retest short entry — this entry offers a better risk-reward than the initial breakdown
Trading the pattern without a clear neckline level — without a defined neckline, the pattern cannot be properly measured or traded
Double Top — Frequently Asked Questions
What is a double top pattern?
A double top is a bearish reversal pattern that forms after an uptrend. It shows price reaching approximately the same high twice (the "M" shape) before reversing. When price breaks below the trough between the two peaks (the neckline), it confirms the reversal.
How do I trade a double top?
There are two main entries: (1) Short the neckline breakdown on strong volume with a stop above the second peak, or (2) Wait for a rally back to the neckline after the breakdown — which now acts as resistance — and short the rejection. The second approach typically offers a better risk-reward ratio.
What is the price target for a double top?
Measure the vertical distance from the peaks down to the neckline, then project that distance downward from the neckline breakdown point. This gives the minimum expected move.
Can a double top fail?
Yes. A double top fails when the price breaks above the second peak after the neckline break, or when the neckline holds as support. False breakdowns below the neckline on low volume are a common trap. Always use a stop loss above the second peak to protect against a failed pattern.