Back to Patterns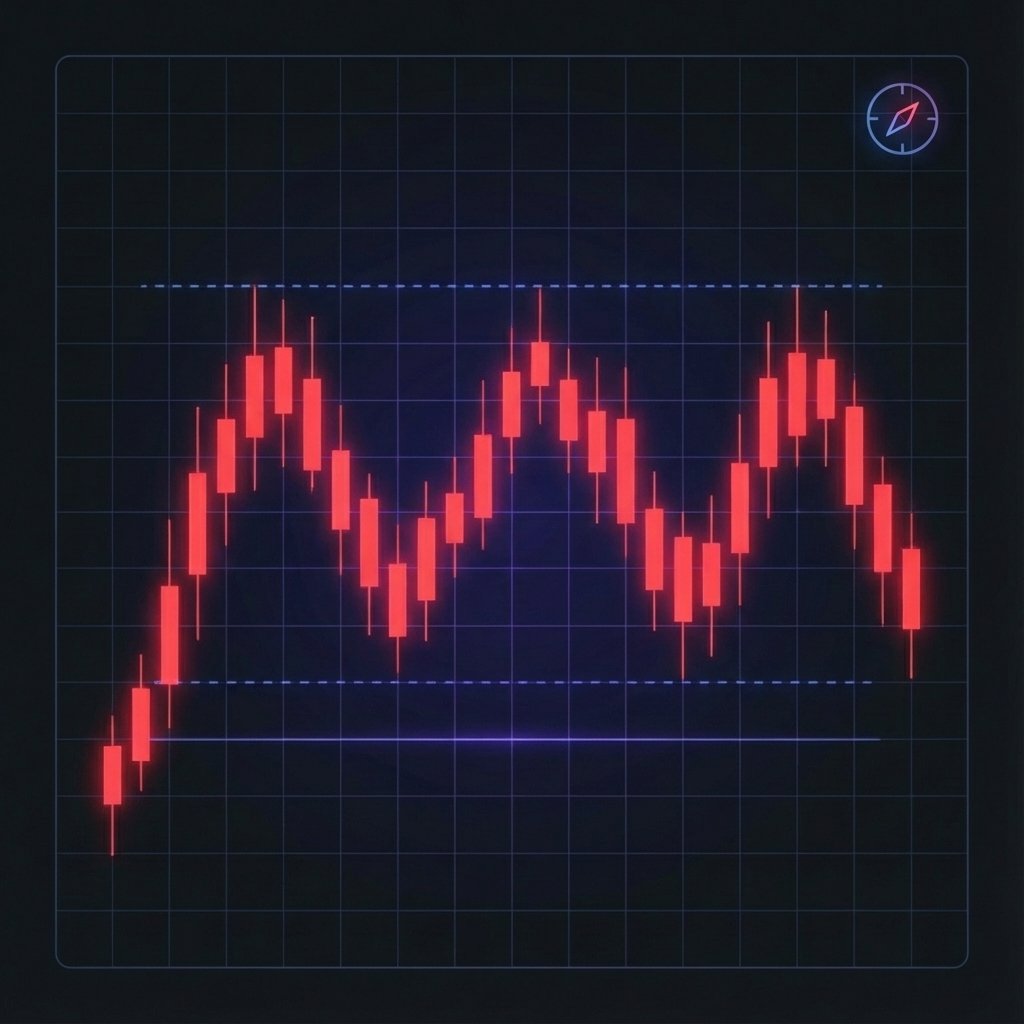
neutral Signal
Rectangle
A rectangle pattern forms when price consolidates between a clear horizontal support level and a horizontal resistance level, creating a well-defined range-bound trading zone. It can break in either direction but tends to continue in the direction of the prior trend.
How to Trade
Trade the breakout: enter long on a confirmed close above the resistance level or short on a confirmed close below the support level. Range traders may also buy near support and sell near resistance within the rectangle, though breakout trading typically offers better risk-reward.
Market Psychology
The market is in temporary equilibrium — buyers defend support and sellers defend resistance with roughly equal conviction. Neither side can gain a decisive edge. When one side finally absorbs all the supply or demand at their level, the imbalance produces a sharp move in the direction of the breakout.
Technical Diagram
This visual represents the ideal candle formation and breakout points for the Rectangle pattern.
Key Characteristics
At least two clearly defined touches of both the horizontal support and resistance levels
The support and resistance lines should be as horizontal (flat) as possible — titled lines indicate a different pattern
Price oscillates between the two levels multiple times before the breakout
Volume typically contracts during the rectangle and expands on the eventual breakout
The breakout candle should close clearly outside the boundary, not just pierce it intrabar
Trading the Rectangle
Entry Signals
For breakout trading: enter on a confirmed candle close above resistance (long) or below support (short) accompanied by a volume surge. For range trading within the pattern: buy on the touch of support with a stop below it, and sell at resistance. Breakout trades have higher profit potential; range trades have more entries but smaller individual gains.
Risk Management
For breakout longs: stop below the resistance level (now support). For breakout shorts: stop above the support level (now resistance). For range trades: stop just outside the boundary being tested. If price re-enters the rectangle after a breakout, treat it as a false break and exit.
Profit Targets
The measured move target is the height of the rectangle projected in the direction of the breakout. For example, a rectangle that is 10 points tall breaking out to the upside at 100 targets 110. Rectangles that have been consolidating for a long time often produce moves that significantly exceed this target.
Timeframes
Rectangles appear on all timeframes and are one of the most common consolidation patterns. On daily and weekly charts, they represent significant periods of institutional accumulation or distribution. The longer a rectangle consolidates, the more energy is built up and the more powerful the eventual breakout tends to be.
Volume Context
Volume should decline steadily throughout the rectangle formation — this reflects the balance between buyers and sellers. As the breakout occurs, volume should surge significantly. In particular, watch for volume to spike on the breakout candle close. Breakouts on low volume from rectangles are among the most common false breakout setups in trading.
Historical Success Rate
Rectangle patterns have a breakout success rate of approximately 68–74% for continuation breakouts (in the direction of the prior trend) according to research data. Counter-trend rectangle breakouts (breaking against the prior trend direction) have lower success rates, around 52–58%. The longer the rectangle, the more reliable the breakout tends to be.
Common Mistakes to Avoid
Entering a breakout trade before the candle closes outside the boundary — intrabar pierces of the level frequently reverse before the close
Assuming the breakout will always be in the prior trend direction — approximately 30% of rectangles break against the prior trend
Trading too many false breakouts — use volume confirmation strictly to filter out low-probability setups
Over-trading the range — the more times you trade within the rectangle, the higher your cumulative risk; focus on high-quality range extremes
Using the same stop distance regardless of rectangle height — wider rectangles require wider stops, and position sizes should be adjusted accordingly
Rectangle — Frequently Asked Questions
What is a rectangle chart pattern?
A rectangle is a consolidation pattern where price bounces between a flat support and a flat resistance level, forming a trading range. It can break in either direction. The breakout from the rectangle — confirmed by price closing outside the boundary on elevated volume — signals the next directional move.
How do I trade a rectangle pattern?
There are two approaches: (1) Breakout trading — enter in the direction price closes outside the rectangle boundary with volume confirmation; (2) Range trading — buy near support and sell near resistance within the pattern. Breakout trading offers larger profit potential; range trading works best in established, well-defined ranges.
What is the profit target for a rectangle?
For breakout trades, measure the height of the rectangle and project that distance in the direction of the breakout. A rectangle that is 5 points tall breaking upward at 50 targets 55 as the minimum measured move.
How is a rectangle different from a channel?
Both patterns have parallel support and resistance lines, but a rectangle's lines are horizontal (flat), while a channel's lines slope either upward (ascending channel) or downward (descending channel). A rectangle signals consolidation in a specific price zone, while a channel signals a trending move.