Back to Patterns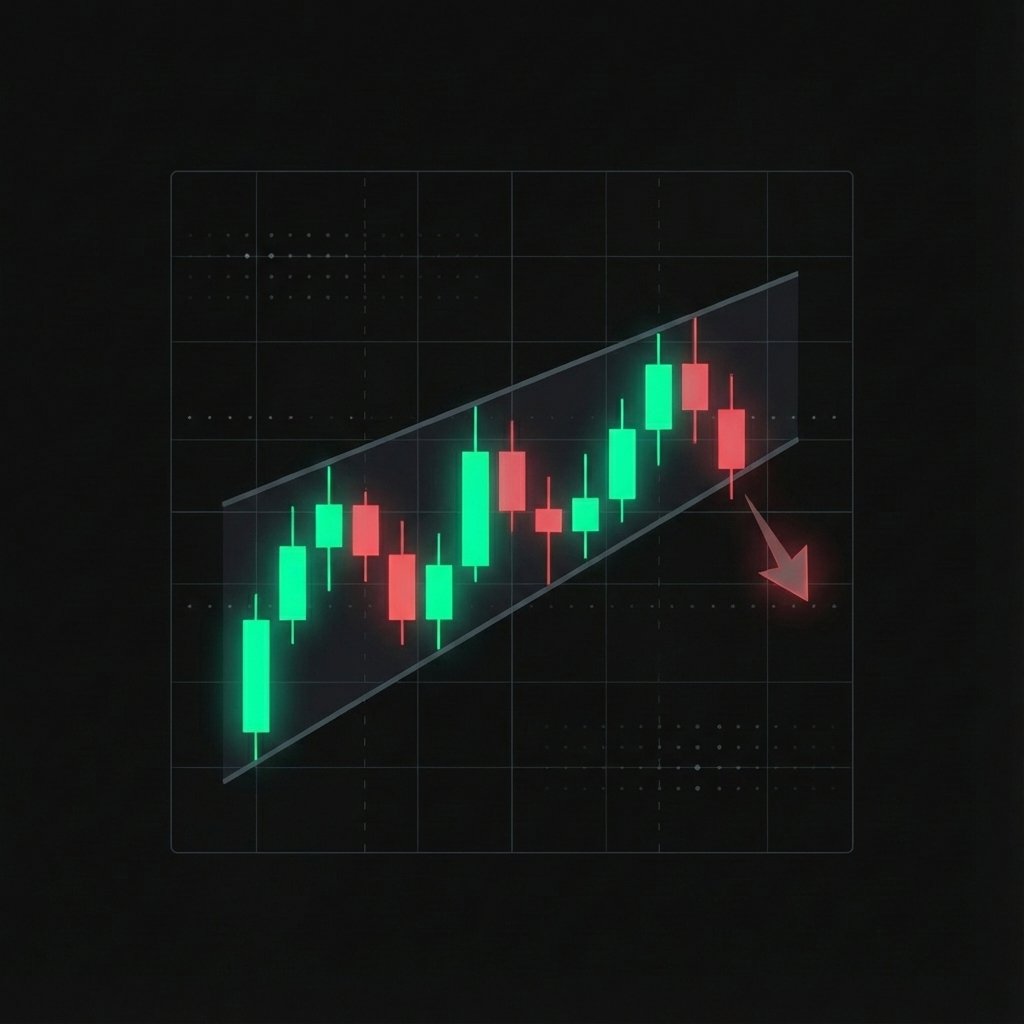
bearish Signal
Rising Wedge
A rising wedge is a bearish reversal pattern that forms when price makes higher highs and higher lows within a narrowing channel that slopes upward. Despite the upward price action, the narrowing range signals weakening momentum and typically resolves with a sharp breakdown.
How to Trade
Enter a short position when price breaks below the lower trendline of the wedge on a confirmed candle close. Set a stop loss above the most recent swing high within the wedge. The target is the height of the wedge projected downward from the breakdown point.
Market Psychology
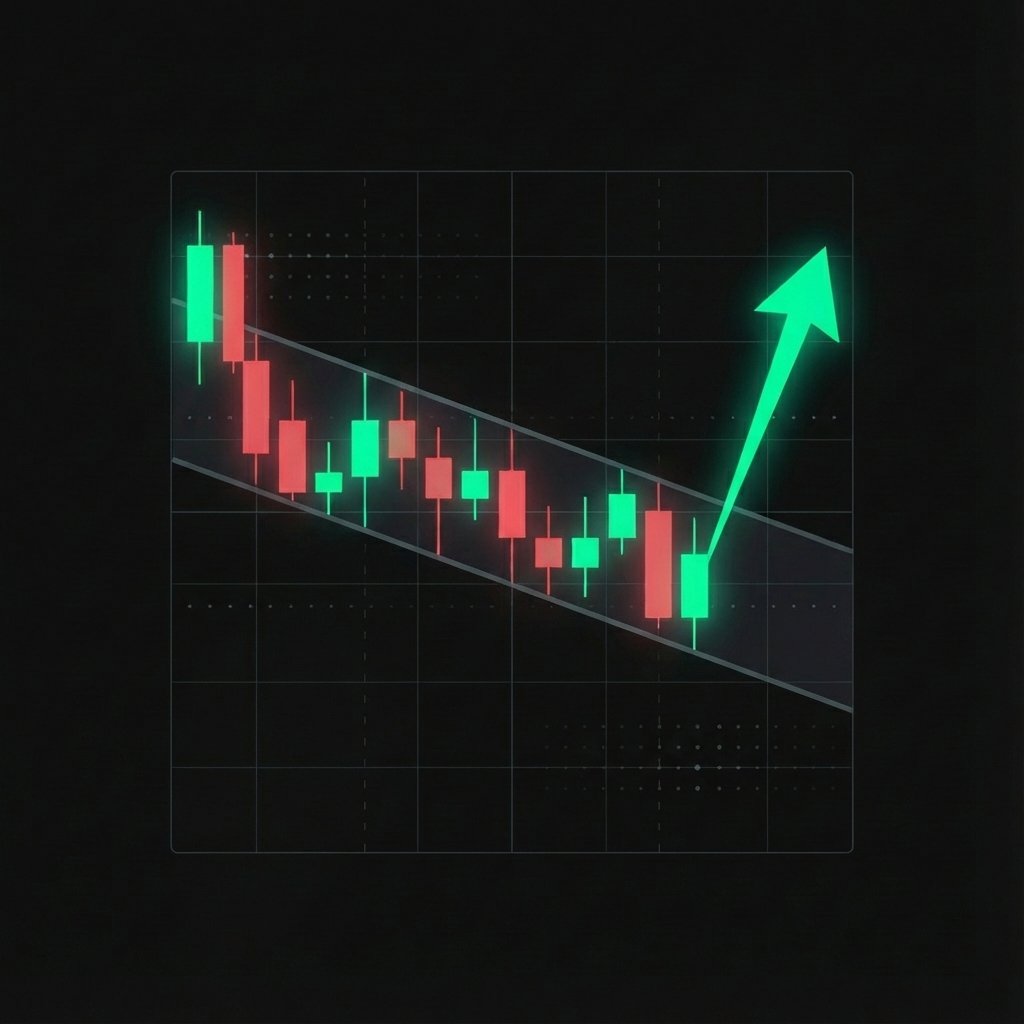
Buyers are gradually losing steam as each rally produces a smaller gain than the last. The narrowing price range shows that bulls are struggling to maintain momentum. When the lower support trendline breaks, trapped longs rush to exit simultaneously, often producing a fast and sharp decline.
Technical Diagram
This visual represents the ideal candle formation and breakout points for the Rising Wedge pattern.
Key Characteristics
Price makes higher highs and higher lows within two upward-sloping, converging trendlines
The upper resistance trendline has a steeper slope than the lower support trendline
Volume declines steadily throughout the wedge, confirming waning buying interest
The wedge pattern requires at least 4 contact points (2 on each trendline) to be valid
A breakdown below the lower trendline, ideally on above-average volume, confirms the pattern
Trading the Rising Wedge
Entry Signals
Enter short on a confirmed candle close below the lower support trendline of the wedge. Look for volume to expand on the breakdown. Aggressive traders may enter intrabar; conservative traders wait for the close. A retest of the broken support trendline (now resistance) after the breakdown offers a second, often cleaner entry.
Risk Management
Place the stop above the most recent high within the wedge, or above the upper trendline. The pattern is invalidated if price makes a new high above the wedge. Risk 1–2% of capital per trade. Use the distance from the breakdown point to the stop loss to determine position size.
Profit Targets
Measure the height of the wedge at its widest point (the leftmost part). Project that distance downward from the breakdown point. The first target is the level where the wedge began (the starting point of the lower trendline). The pattern often targets the origin of the initial price move that preceded the wedge.
Timeframes
Rising wedges are effective on daily and 4-hour charts for swing traders, and on 15-minute to 1-hour charts for day traders. They are particularly powerful when they form at prior highs or after large rallies, as they often signal the exhaustion of an entire trend leg.
Volume Context
Declining volume throughout the wedge is a critical signal — it shows buyers are becoming less and less committed to pushing the price higher. The breakdown should ideally be accompanied by a surge in volume. This volume expansion confirms that sellers have taken control and the move is genuine rather than a false breakdown.
Historical Success Rate
Rising wedge patterns are reported to have a success rate of approximately 69% on daily charts. The pattern is most reliable when it forms after a prolonged uptrend (acting as a reversal at a major top) compared to when it forms mid-trend as a consolidation. Volume contraction throughout the wedge significantly improves reliability.
Common Mistakes to Avoid
Shorting inside the wedge before the breakdown — the wedge can continue for longer than expected, stopping premature shorts out
Confusing a rising wedge with a bullish channel — a rising wedge has converging trendlines while a bullish channel has parallel ones
Ignoring volume declining as the wedge forms — this volume signature is a key distinguishing characteristic of a valid rising wedge
Missing the breakdown retest entry — after the initial breakdown, a retest of the broken lower trendline often provides a superior short entry
Expecting the breakdown to happen at the apex — breakouts in the final 20% of the wedge are less reliable
Rising Wedge — Frequently Asked Questions
What is a rising wedge pattern?
A rising wedge is a bearish pattern where price makes higher highs and higher lows within an upward-sloping channel with converging trendlines. Despite the upward price action, weakening momentum (shown by declining volume) suggests the pattern will resolve with a breakdown.
Is a rising wedge always bearish?
In most cases, yes — rising wedges are bearish approximately 69% of the time. They are most reliably bearish when they form at the top of an extended uptrend. When they form as mid-trend consolidations, there is a higher probability of an upside continuation, so context and volume always matter.
What is the difference between a rising wedge and an ascending triangle?
In a rising wedge, both trendlines slope upward and converge, giving the pattern a bearish bias. In an ascending triangle, the top resistance is flat while the bottom support rises — giving it a bullish bias. The direction of the resistance line is the key distinguishing factor.
How do I set a profit target for a rising wedge?
The standard method is to measure the wedge height at its widest point (the left side) and project that distance downward from the breakdown point. An alternative target is the price level at which the wedge began — the starting point of the lower trendline.